

Data analytics services
Data Analytics Services
Built Around Better Decisions
SensViz brings data from your systems into a reliable foundation, then turns it into dashboards, reports, forecasts, and alerts your teams can use. We define the metrics, build the pipelines and models, and deliver analytics that fit the way your business operates.
From data to decisions
Get one reliable view of what is happening
Important information is often split across applications, databases, spreadsheets, and manual reports. Teams lose time reconciling numbers, and decisions slow down when each report defines the same metric differently. SensViz starts with the questions people need to answer and the actions those answers support. We then assess the sources, data quality, definitions, access, refresh needs, and technical constraints before building the analytics layer.
What we build
Data analytics services from foundation to decision
A useful analytics system needs more than a dashboard. We connect the data, define its meaning, test its quality, and deliver the right view for the people who need to act on it.
Data strategy and architecture
Define the business questions, source systems, target architecture, governance needs, delivery priorities, and a practical roadmap for the data capability.
Data engineering and integration
Build batch, scheduled, or streaming pipelines that collect and transform data from databases, applications, APIs, files, and operational systems.
Warehouses, lakehouses, and data models
Organise raw and transformed data in an analytical platform, then create reusable models and metric definitions for consistent reporting.
BI dashboards and reporting
Create executive, operational, and customer-facing dashboards with the filters, drilldowns, access controls, and refresh patterns each audience needs.
Predictive and advanced analytics
Use forecasting, anomaly detection, segmentation, trend analysis, and statistical or machine-learning methods when they improve a defined decision.
Data quality, governance, and monitoring
Add validation, ownership, lineage, access rules, documentation, freshness checks, and pipeline monitoring so teams can understand and trust the output.
Where analytics helps
Build around a decision, not another report
The best starting point is a recurring decision with a clear owner, known data sources, and a useful measure of success. These are common areas where a focused analytics build can replace guesswork or manual reporting.
Executive and operational dashboards
Track agreed KPIs, trends, exceptions, and performance across teams or locations.
Sales, revenue, and customer analytics
Understand pipeline, conversion, retention, customer behaviour, and revenue patterns using consistent definitions.
Product and user analytics
Measure adoption, journeys, feature use, cohorts, and friction inside digital products.
Forecasting and planning
Estimate demand, workload, revenue, capacity, or other time-based outcomes with clear assumptions and evaluation.
IoT and time-series monitoring
Analyse readings and events over time, detect unusual patterns, and present the information to the people responsible for action.
Embedded analytics
Add secure dashboards, reports, or analytical features directly inside a SaaS platform, web app, or mobile product.
Build the foundation first
Fix the definitions before adding more dashboards or AI
If source data is incomplete, pipelines fail silently, or teams calculate the same KPI differently, a faster dashboard only makes the inconsistency more visible. Reliable analytics starts with clear definitions, tested transformations, appropriate access, and an owner for each important dataset or metric.
Connect and ingest
Bring approved data from applications, databases, APIs, files, and event streams into the analytical flow.Clean and validate
Check formats, missing values, duplicates, ranges, relationships, and business rules before data reaches decision-makers.Model business meaning
Create reusable definitions for customers, products, events, dimensions, measures, and KPIs.Analyse and present
Deliver dashboards, reports, forecasts, alerts, or embedded views that answer a defined question.Monitor and maintain
Track freshness, pipeline runs, quality checks, access, usage, cost, and changes to source systems.How we deliver
From business question to a maintained analytics system
Each engagement begins with the decision and the people who will use the output. The process keeps data engineering, business definitions, analytics, validation, and ownership connected from the start.

Questions and KPI discovery
Identify the decisions, users, current reports, source systems, definitions, pain points, and the measures that should improve.
Data audit and architecture
Assess access, quality, volume, history, refresh needs, privacy, constraints, and the most suitable target design.
Pipelines and modelling
Build and test ingestion, transformations, data models, metric logic, documentation, and quality checks.
Analytics build and validation
Create the dashboards, reports, forecasts, alerts, or embedded views, then validate definitions and outputs with business owners.
Launch, adoption, and monitoring
Deploy with access controls, handover, training, refresh monitoring, support ownership, and a plan for future changes.
Relevant data experience

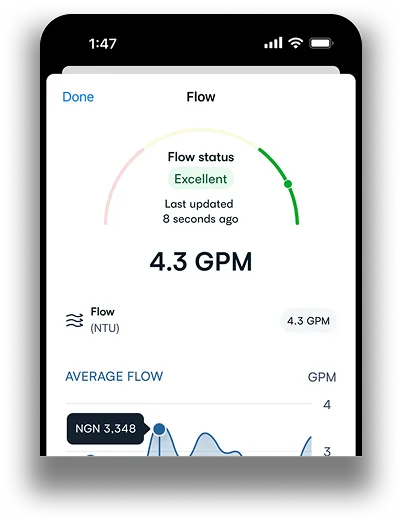
SIPP: time-series forecasting for water-quality data
SensViz developed a data-driven system for SIPP that analyses water-quality readings over time and applies time-series forecasting to help surface trends and future patterns.
The project brings historical readings, trend analysis, forecasting, and a user-facing product experience together so information can be reviewed in context rather than as isolated measurements.
Why SensViz
Why businesses choose SensViz for data analytics
Data projects sit between business definitions, engineering, analytics, and product experience. SensViz keeps those parts connected so the final system is understandable to the people who use it and maintainable by the team responsible for it.
We start with the decision
The business question, audience, and next action shape the metrics, architecture, and interface.
Data and product engineering stay connected
Pipelines, APIs, databases, dashboards, and embedded product features can be delivered as one system.
Metrics are defined before visualisation
Important calculations, dimensions, filters, and ownership are agreed before dashboards multiply.
Quality and monitoring are part of the build
Validation, freshness checks, logging, alerts, and change ownership are planned with the data flow.
The stack follows the use case
We assess the current environment, scale, skills, access, timing, and cost before recommending platforms.
Handover and support are clear
Code, models, dashboards, documentation, accounts, licences, and post-launch responsibilities are defined in the agreement.
Choose the right delivery path
Related AI and software services
A data project may support analytics, automate a process, power an AI capability, or become part of a complete software product. Use the service that matches the main outcome you need.
Data analytics questions businesses ask before starting
Data analytics services help a business collect, prepare, model, analyse, and present data for defined decisions. A project may include strategy, integration, pipelines, a warehouse or lakehouse, semantic models, dashboards, reporting, forecasting, quality checks, governance, and ongoing monitoring.
Data engineering moves, transforms, stores, and monitors data. Business intelligence organises metrics and presents them through reports and dashboards. Data science uses statistical and machine-learning methods for questions such as forecasting, segmentation, and anomaly detection. A complete project may use all three.
A solution can connect databases, applications, APIs, files, and event sources when suitable access is available. The final design depends on permissions, vendor limits, data volume, refresh frequency, security requirements, and the condition of the source data.
Not always. Real-time or streaming analytics is useful when a decision must respond to events as they happen. Daily, hourly, or scheduled refreshes are often simpler and more economical when the business action does not require immediate data.
Yes. The work may include reviewing metric definitions, source quality, data models, refresh reliability, performance, access, usability, and whether each report still supports a real decision. A visual redesign alone will not fix unreliable data or conflicting definitions.
AI-ready data is suitable for a specific AI use case because its quality, permissions, context, lineage, update pattern, and limitations are understood. The required preparation depends on the model, decision, risk, and system in which the output will be used.
The platform should be selected around your existing stack, users, data volume, latency, access, governance, team skills, and budget. SensViz can recommend an approach after reviewing the environment. Any named platform capability should be confirmed during discovery.
The measures depend on the use case. They may include data freshness, pipeline reliability, quality-test results, report usage, time to produce a report, decision turnaround, forecast error, alert relevance, query performance, platform cost, and qualified business outcomes.
Ownership and access are defined in the project agreement. SensViz's standard approach is to hand over the agreed custom deliverables and documentation, while third-party platforms, connectors, libraries, and services remain subject to their own licences and terms.
Working out the shape of a data project? See AI and software project pricing for how we scope and cost the work.
Start with the question
Turn scattered data into something your team can use
Tell us which reports take too long, which numbers people disagree on, or which decisions lack visibility. We will review the users, sources, metrics, refresh needs, and current tools, then recommend a focused data and analytics plan.